Simulación de aeropuerto What is airport simulation?
Airport simulation is the computer-based modeling of any real-world process involved with an airport. Simulation allows organizations in the industry to analyze and experiment with their processes in a virtual setting, reducing the time and cost requirements associated with physical testing. Security, gates and luggage services can be analyzed and tested within a simulation model, giving airports the opportunity to determine how best to fully utilize their resources at the lowest possible cost—and without compromising safety.

Why simulate airports?
The need for efficiency in airports has never been greater, with security and labor costs continuing to rise each year. Successful airport authorities need to ensure that the costs associated with personnel, equipment and new technology are being considered and optimized. At its core, airport simulation is an inexpensive, risk-free way test your current terminal layout and security areas, always with the purpose of meeting passenger throughput goals at the lowest possible cost, and with the lowest achievable safety risk. And unlike spreadsheet-based analysis and forecasting, simulation offers a quick and efficient way to adjust parameters and re-simulate, saving valuable time with quicker results.
¿Por qué FlexSim?
There are three unique advantages to using FlexSim’s 3D simulation modeling platform:
- FlexSim allows for valuable experimentation on your system. Different scenarios can be set up and tested over multiple iterations in the simulation environment, without the risks and excess time involved with testing changes in the real world.
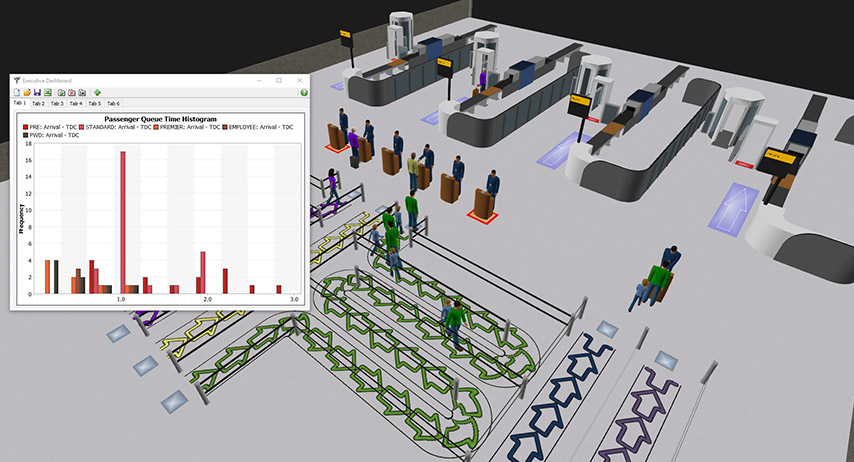
- Use the data you collect to predict the future state of your system. Con FlexSim, you have control over your data. Export the simulation results for deeper analysis, or display it using FlexSim’s powerful and customizable charts and graphs.
- Our fully 3D graphics engine will let you visualize the process as it runs. This is a key element of our two-step validation process—any queuing problems suggested by the data can be visually confirmed by watching the simulation unfold in real time.
Casos de éxito
Proceso de selección de la TSA
Cuando el Administración de Seguridad del Transporte (TSA) launched their TSA PreCheck program, they anticipated that upwards of 50% or more airline passengers would eventually participate. Since security lines must accommodate several passenger types, including passengers with disabilities (PWD) and employee/flight crew, the TSA wanted solutions for an optimal line configuration that will incorporate the new TSA PreCheck process efficiently.
A simulation model of the system was developed using FlexSim. The arrival data showed two peak arrival periods, which was used to forecast the number of Travel Document Checker (TDC) stations that would be required at different times of day. Five worker shift periods were created to account for the variance in arrival rates, and provided a baseline on which to test what-if conditions for the number of TDC agents required.
Three scenarios were tested:
- Escenario 1: Seven (7) agents in each of the high peak periods (4:30 am to 9:00 am, and 3:00 pm to 6:30 pm) and 5 agents in the medium peak period (9:00 am to 3:00 pm).
- Escenario 2: Reduce the number of agents in the high peak periods and the medium peak period by one (6 agents for high peak, 4 agents for medium peak).
- Escenario 3: Further reduce the number of agents by one, for a total of 5 agents for the high peak and 3 agents for the medium peak.
Once the baseline was set, a second set of scenarios were tested under an alternate waiting line configuration—two low volume lines, PWD and employee/flight crew were combined with the hope that waiting times would not increase significantly.
Resultados
By removing two total agents across each of the three peak periods (the difference between Scenario 1 and Scenario 2), average waiting times for TSA PreCheck passengers increased by 55 percent (2 minutes to 3.1 minutes). Regular passengers experienced a much greater increase (180 percent), with their average waiting time going from 2.5 minutes in Scenario 1 to 7 minutes in Scenario 3. In addition, it was shown that combining lines with a low utilization rate has little impact on either PWD passengers or employee/flight crews—a change that was recommended immediately.